Dashboard highlighted: General
Zurück zu Blogs
Dashboard highlighted: General


EduViewz: description dashboard “General”
Reading time: 3 minutes
EduViewz has been developed to give educational institutions insight into the data that is already available within educational institutions. By displaying this data clearly, visually and interactively, the requested data can be viewed, interpreted and analyzed in an accessible way. Because the data in EduViewz is always available, a comparison can always be made with historical data. Ultimately, it is even possible to make predictions for the future based on the historical data. EduViewz is available in Dutch, English and German.
EduViewz displays data in various dashboards. In the coming period we will introduce you to the different parts by means of articles.
In this article, the General dashboard is highlighted. This dashboard provides the end user with various data related to the student population.
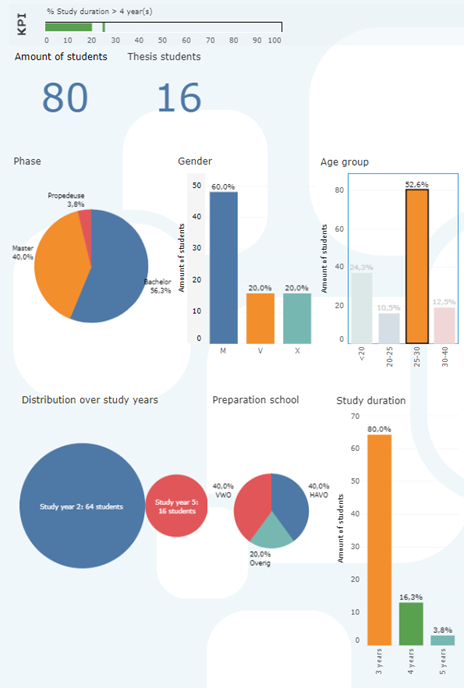
KPI
By adding Key Performance Indicators (KPIs) to a dashboard, the end user can immediately see whether the set objectives have been achieved or whether adjustments still need to be made in the process. The set goals and the number of KPIs can be determined by educational institutions themselves.
In the General/Student Population dashboard, an educational institution can include a KPI with which the objective with regard to achieving the study within the set time is indicated. An example of this is „A maximum of 25% of the students are enrolled for more than 4 years from the first registration date“.
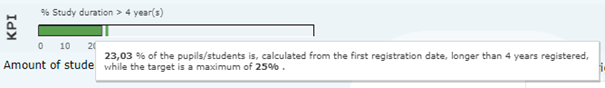
In this overview, the end user immediately sees that the goal (a maximum of 25% of the students have been enrolled for more than 4 years) has been achieved.
Studentpopulation
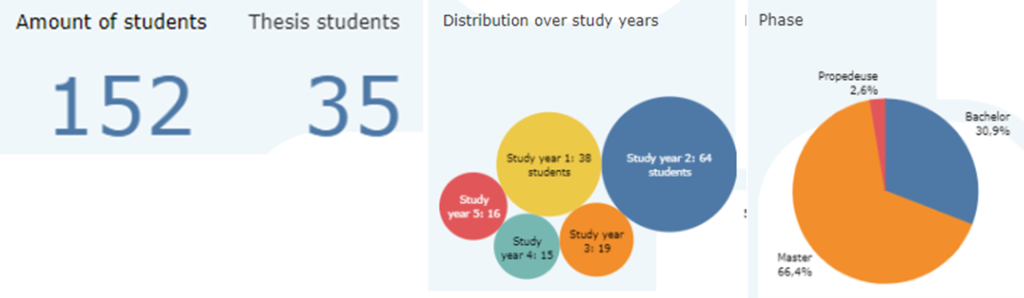
In addition to the KPIs, the dashboard generally shows the different aspects of the student population in a number of fields. The first is the total amount of students enrolled. The number of thesis students is shown separately. This total overview is subdivided by means of a number of other visuals into distribution over study year and distribution in the phase of the study in which a student finds himself.
In addition, the end user can gain insight into the gender of the students, to which age group they belong, which preparation school the students have followed and how long they have been studying.
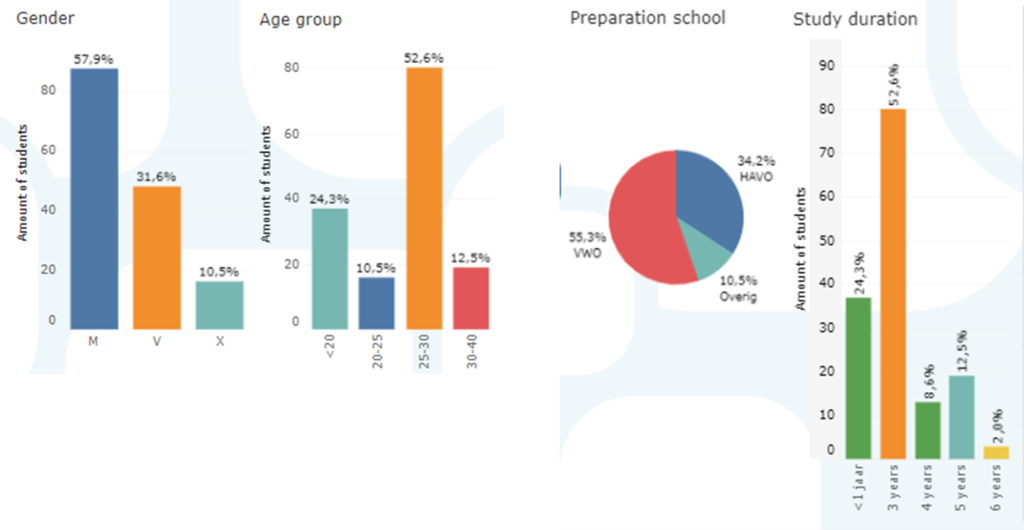
All individual visuals can be clicked through for more information. The moment the end user clicks the „age group 25-30“, all the information shown is converted to this specific age group.
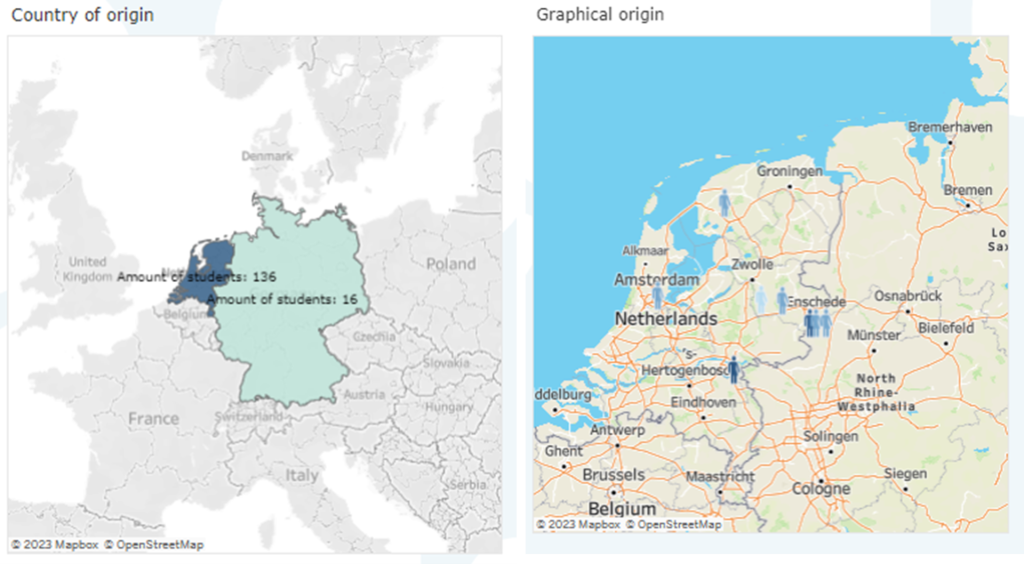
In the Netherlands, around 600,000 HBO and WO students study every year. Approximately 510,000 students are trained in MBO every year. The Netherlands is also popular with foreign students. In 2019, approximately 86,000 foreign students followed a study in the Netherlands. The origin of both country and geographical area is also displayed in EduViewz. These visuals can be zoomed in as well as zoomed out for a total overview.
Generic filters
Finally, the end user can select filters himself, after which the visuals are visualized. Examples of filters are, freely selectable registration date and a selection of different faculties, academies or departments. In this way, the end user can visualize the information of the overarching educational institution, but can also bring the information back to faculty, academy or department level.
Mehr erfahren?
„*“ zeigt erforderliche Felder an
Verwandte Blogbeiträge

Dashboard highlighted: Schedule Reading time: 2 minutes EduViewz has been developed to give educational institutions insight into the data that is already available within educational institutions. By displaying this data…

(for Dutch see below) These weeks are all about the ‚onboarding‘ of a new customer for EduViewz. How do we approach that, onboarding such a customer? A glimpse… Before an…
