Dashboard highlighted: Schedule
Reading time: 2 minutes 

EduViewz has been developed to give educational institutions insight into the data that is already available within educational institutions. By displaying this data clearly, visually and interactively, the requested data can be viewed, interpreted and analyzed in an accessible way. Because the data in EduViewz is always available, a comparison can always be made with historical data. Ultimately, it is even possible to make predictions for the future based on the historical data. EduViewz is available in Dutch, English and German. 

EduViewz displays data in various dashboards. In the coming period we will introduce you to the different parts by means of articles.

Dashboard Schedule

In this article, the Schedule dashboard is highlighted.

If students feel at home in an educational environment, they have a greater chance of successfully studying and obtaining the diploma. A good class schedule is helpful in this. The dashboard Schedule provides the end user with different dates regarding schedule changes. Changes in schedule are calculated by evaluating all activities in the scheduling system.

KPI

By adding Key Performance Indicators (KPIs) to a dashboard, the end user can immediately see whether the set objectives have been achieved or whether adjustments still need to be made in the process. The set goals and the number of KPIs can be determined by educational institutions themselves.

In the dashboard schedule, an educational institution can include a KPI with which the objective with regard to the maximum desired percentage of schedule changes is indicated.

Schedule KPI


In this overview, the end user immediately sees that the target (maximum 25% schedule changes) has not been achieved. The total number of activities and the schedule changes are also shown. The above example is the total overview of the entire educational institution. KPIs can also be displayed at faculty, department or educational level.

Schedule KPI

Schedule changes may vary in nature. For example, a room can change, the activity can take place at a different time or date, the description of the activity is adjusted or the activity is given by another lecturer. All these changes are also visible in the dashboard.

Amount of schedule changes

The end user can also set a number of general filters so that the data between a start and end date or per period can be called up.

Filter dashboard

EduViewz: description dashboard “General”
Reading time: 3 minutes

EduViewz has been developed to give educational institutions insight into the data that is already available within educational institutions. By displaying this data clearly, visually and interactively, the requested data can be viewed, interpreted and analyzed in an accessible way. Because the data in EduViewz is always available, a comparison can always be made with historical data. Ultimately, it is even possible to make predictions for the future based on the historical data. EduViewz is available in Dutch, English and German.

EduViewz displays data in various dashboards. In the coming period we will introduce you to the different parts by means of articles.

EduViewz startpage

In this article, the General dashboard is highlighted. This dashboard provides the end user with various data related to the student population.

KPI

By adding Key Performance Indicators (KPIs) to a dashboard, the end user can immediately see whether the set objectives have been achieved or whether adjustments still need to be made in the process. The set goals and the number of KPIs can be determined by educational institutions themselves.

In the General/Student Population dashboard, an educational institution can include a KPI with which the objective with regard to achieving the study within the set time is indicated. An example of this is „A maximum of 25% of the students are enrolled for more than 4 years from the first registration date“.

KPI

In this overview, the end user immediately sees that the goal (a maximum of 25% of the students have been enrolled for more than 4 years) has been achieved.

Studentpopulation

In addition to the KPIs, the dashboard generally shows the different aspects of the student population in a number of fields. The first is the total amount of students enrolled. The number of thesis students is shown separately. This total overview is subdivided by means of a number of other visuals into distribution over study year and distribution in the phase of the study in which a student finds himself.

Various insights

In addition, the end user can gain insight into the gender of the students, to which age group they belong, which preparation school the students have followed and how long they have been studying.

Various insights

All individual visuals can be clicked through for more information. The moment the end user clicks the  „age group 25-30“, all the information shown is converted to this specific age group.

Complete dashboard

In the Netherlands, around 600,000 HBO and WO students study every year. Approximately 510,000 students are trained in MBO every year. The Netherlands is also popular with foreign students. In 2019, approximately 86,000 foreign students followed a study in the Netherlands. The origin of both country and geographical area is also displayed in EduViewz. These visuals can be zoomed in as well as zoomed out for a total overview.


Geographical overview

Generic filters

Finally, the end user can select filters himself, after which the visuals are visualized. Examples of filters are, freely selectable registration date and a selection of different faculties, academies or departments. In this way, the end user can visualize the information of the overarching educational institution, but can also bring the information back to faculty, academy or department level.


 (for Dutch see below)

These weeks are all about the ‚onboarding‘ of a new customer for EduViewz. How do we approach that, onboarding such a customer? A glimpse…

Before an educational institution can actually use EduViewz, some things have to be aligned. We call this alignment the ‚onboarding‚.

Processes and people

First of all, we look at the processes and users together with the customer. How are the systems, such as the timetable system and the student information system, used? How are they furnished? And what insights and steering information is desired based on the available data?

Once this is clear, the corresponding EduViewz dashboards will be activated, and we will discuss with the customer which source information is visible on the relevant dashboards. We go through wishes, such as the use of certain terminology, together with the educational institution and together we decide to what extent this will be processed in EduViewz.

Interfaces with systems

Both the technology and the functional operation of the interfaces are discussed and the expectations and commitments are recorded. Which fields do we read? And how often? Should the data be read in ‚raw‘, or should EduViewz still apply changes to it?

Once that has been discussed, we set up the link so that we are able to read in data.

Access

The end users receive login details to be able to log in to EduViewz, and EduViewz receives access to source systems such as the schedule packer from the educational institution.

Project

We take on the above activities on a project basis. In this way we keep a good overview and we can make quick adjustments if necessary. But the most important thing is that we communicate with the customer on a weekly basis about the progress of both parties. This way we are not faced with any surprises and EduViewz can be used quickly.

Would you like to know more about how EduViewz can be implemented? Let us know, we’ll be happy to discuss it with you!

Keeping the costs of running an educational facility as low as possible is essential for any academic institution wanting to stay within budget and maximize resources. Whether a public or private school, university, technical college, or other similar learning facilities, there are many different strategies at your disposal to help you keep your costs under control without sacrificing the quality of education. In this blog post, we will discuss some strategies for effectively managing institutional expenses and how EduViewz incorporated Business Intelligence as a potential solution.

Analyze Your Current Budget and Expenses.
The first step in controlling costs is determining what areas can be improved. For example, labor costs could be reduced through more efficient scheduling or better utilization of staff resources. You may also find that certain facilities, such as labs, halls, and classrooms, are underperforming and can be better put to use by identifying the occupation and utilization rate of those facilities as well as the value they bring or could bring to the institution. Determining these cost savings areas should then be incorporated into future budgets.

But how do you determine which areas need improvement?
This is where Business Intelligence (BI) comes into play. But what is BI? BI is a set of processes and technologies that allow collecting data from multiple sources, analyzing it, and then using the resulting insights and visualizations to make better decisions. It can help organizations identify areas where they could cut back on expenses without sacrificing the quality of their services. For educational purposes, this can include everything from staffing and student retention to managing facilities. An outcome of the usage of BI could be better facility management, which means using different facility types more effectively based on the occupation and utilization rate of a facility by a program or course.

How did EduViewz incorporate BI?
Through years of experience and knowledge of education and logistics, EduViewz turns institutional processes and performance into measurable visualization, providing valuable insights to institutions and allowing data-driven decisions to take place. In this example, EduViewz incorporates BI techniques to evaluate the financial aspects of space and facility costs.

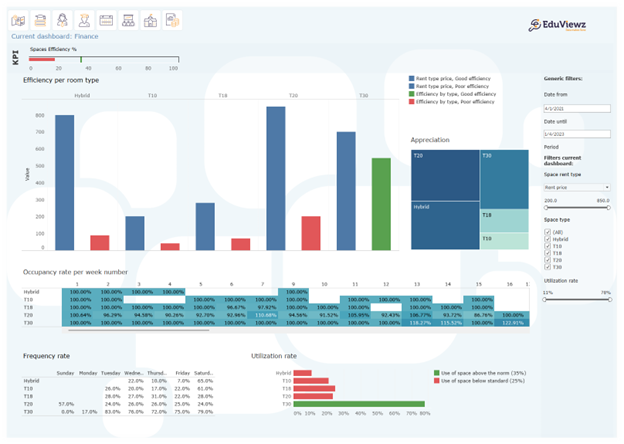
The impact of BI on the educational sector can lead to more focus and efficient use of resources. This is displayed in the example below:

As shown, it is possible to oversee that some available facilities can be underused. This means that costs can be higher than necessary, or institutions need to catch up on logistic revenues by either owning too many rooms and facilities or not taking advantage of their full potential; hence the efficiency and value of those spaces are lost. However, this can be avoided and optimized through BI, which can constantly monitor the use of the institution’s resources for a better outcome.

Conclusion:
Business intelligence can be an incredible tool for managing educational facility expenses while simultaneously ensuring compliance with best-practice regulations across all areas of operation. Organizations can effectively reduce their operational costs by leveraging BI technology solutions without negatively impacting students’ learning experiences. If you have questions or want to know about EduViewz and its practical applications, don’t hesitate to reach out!